
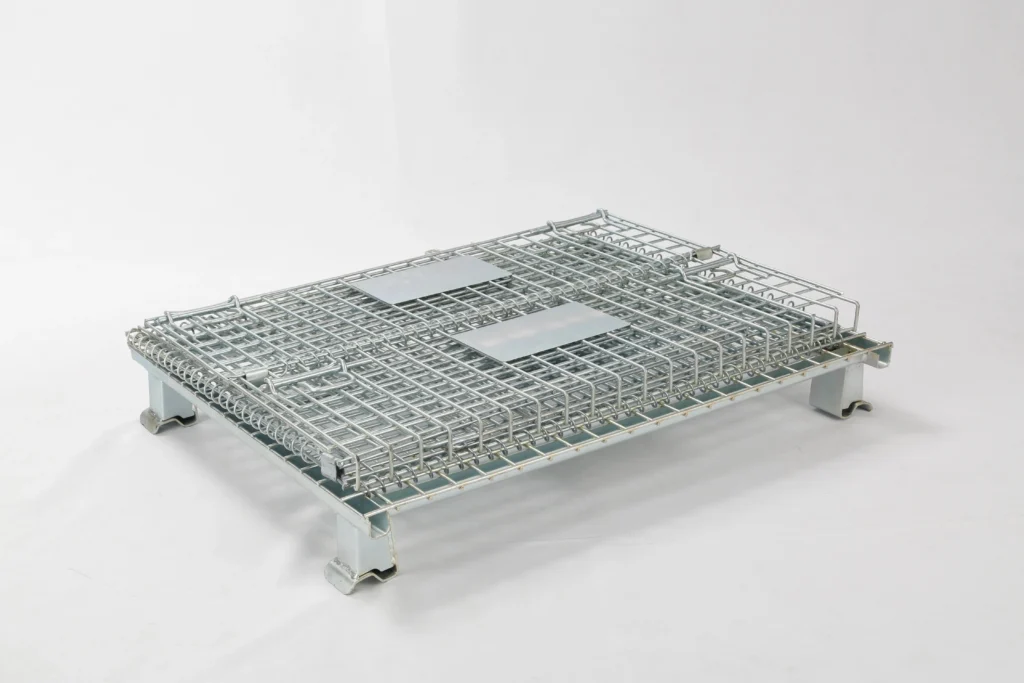
When reusable steel containers return empty, the freight invoice can look like a second outbound shipment: the vehicle is occupied, but no sellable material is moving. For a logistics or supply-chain manager, the first question is not whether a collapsible crate has a higher purchase price. It is how much of each return leg is being paid simply to move air and steel.
A collapsible wire mesh container changes that equation by folding the empty cage into a much lower profile. A 70–80% volume reduction is a common planning range, not a guaranteed result for every model or load plan. The fair comparison is the cost per completed rotation after freight, handling, damage, storage space and the actual number of cycles are included.
First, isolate the empty-leg share of the cost
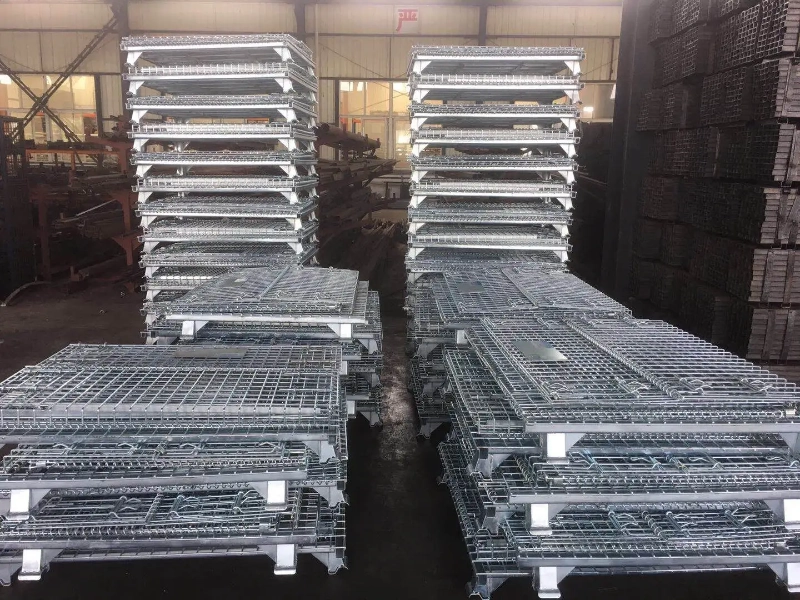
Start with the invoice for one empty return leg. Let empty-return freight be R, the number of rigid containers the vehicle can carry be N₁, and the number of folded containers it can carry be N₂. The empty-return freight allocated to each rigid container is R ÷ N₁; the folded allocation is R ÷ N₂. If the return leg is volume-limited and the folded stack uses 20–30% of the original volume, the theoretical capacity multiplier is about 1 ÷ 0.30 to 1 ÷ 0.20, or roughly 3.3–5 times. In practice, use the carrier’s loading plan—not the headline percentage—because truck dimensions, axle weight, strapping, access and mixed freight can reduce the usable gain.
Run a fair total-cost comparison
Use the same lane, demand and service level for every option. A useful planning equation is: cost per completed rotation = (purchase or rental cost + outbound freight + empty-return freight + loading and unloading + storage and maintenance + loss or damage + end-of-life cost) ÷ completed rotations. For a rigid cage, empty-return freight is often the largest variable when the return truck is volume-limited. For a collapsible cage, replace that line with the actual folded return allocation and add any folding, stacking or inspection labor. Then test three cases: a full truck, a partially filled truck and a return combined with other freight. This avoids claiming savings when the vehicle was already weight-limited or would have returned with paid cargo.
The 70–80% claim belongs in a sensitivity table
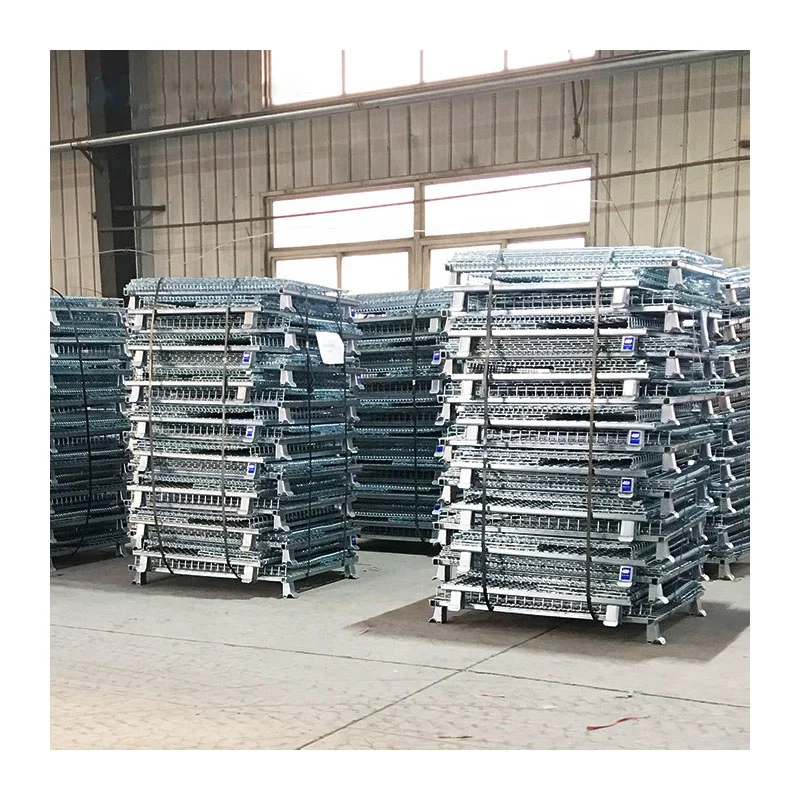
Treat 70–80% as a range for scenario planning. Example only: if a rigid return carries 100 units, a purely volume-based calculation would suggest about 333–500 folded-unit positions. That is not a standard capacity promise; confirm the specific container’s folded height, stack security, truck body and legal weight before quoting savings. In the spreadsheet, show the conservative, midpoint and optimistic cases separately. The decision is strong when the collapsible option still lowers cost under the conservative case, not only when the best-case truck count is used.
Which return-loop option fits your operation?
- Choose collapsible wire mesh containers when empty returns are frequent, the lane is volume-limited, and the same assets cycle between plants, suppliers or distribution points.
- Keep a rigid container when it is normally returned loaded, immediately reused on the next leg, or the lane is weight-limited rather than cube-limited; folding may add handling without reducing the freight bill.
- Consider one-way wood or plastic packaging when assets will not return, reverse logistics is unavailable, or the packaging must be disposable. Compare disposal, damage and replacement costs rather than purchase price alone.
- Consider pooling or backhaul consolidation when several suppliers share the lane. A collapsible crate can complement that plan, but it cannot replace a verified carrier loading plan, safe securing method and agreed asset-return process.
Questions managers usually ask before changing the return loop
How much of the current cost is really caused by the empty return?
Separate the empty-return invoice from loaded outbound freight, handling and storage. Divide the empty-return charge by the number of rigid units actually on that leg, then model the same charge across the folded quantity confirmed by the carrier. If the truck is weight-limited or already has backhaul cargo, the cube-related share may be small.
How do we prove the saving without turning an assumption into a promise?
Record actual loaded and folded dimensions, units per vehicle, return-leg invoices, folding labor, damage and completed cycles for a pilot lane. Report a conservative range and label the 70–80% volume reduction as a planning assumption until the selected Stbox configuration and transport plan are verified.
Need a Custom Storage Solution?
Speak directly with our technical engineers. We offer free structural designs, heavy-duty catalog evaluations, and quick B2B price quotations.
Request a Quote Now →